 ISTOCKPHOTO, ALXPIN
At the end of summer 2006, scientists at NASA, the Department of Defense, the US Department of Agriculture, and the Centers for Disease Control and Prevention were keeping a particularly watchful eye on the Earth’s climate. For several weeks, National Oceanic and Atmospheric Administration (NOAA) satellites and buoys had recorded above-normal sea-surface temperatures in the equatorial Eastern Pacific and Western Indian Oceans. After a few weeks of sustained and abnormally high sea-surface temperatures, increasing amounts of rain began to fall in the Horn of Africa.
By September, nearly three months after the first temperature anomalies had been recorded, satellites were already showing a marked greening of the vegetation in Eastern Africa.
In light of the series of events, scientists at NASA’s Goddard Space Flight Center sent out warnings to the World Health Organization in Geneva, the Food and Agriculture Organization of the United Nations, and the World Organisation...
In response to the warning, countries such as Kenya, Somalia, and Tanzania (to varying degrees) disseminated information about the viral disease and how it spreads; attempted to control the mosquito vector; instituted quarantine measures to stop the movement of already infected animals; implemented the vaccination of cattle; and encouraged personal preventive practices such as the use of mosquito-repellent bed nets.
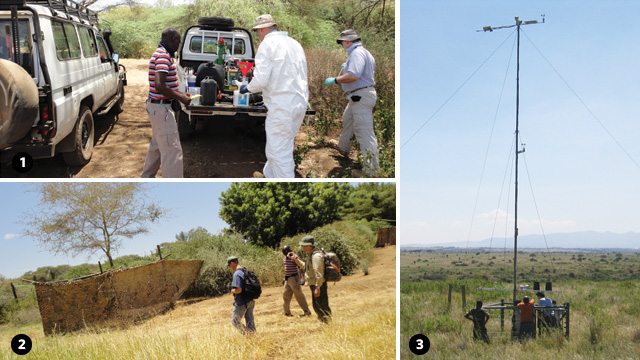
As the warnings were reaching the African countries in September and early October, continual rainfall was flooding the shallow wetlands of northeastern Africa, creating ideal habitats for the mosquitoes carrying Rift Valley fever. By mid-December 2006, Kenya had reported the first human cases of Rift Valley fever. With a lead time of three months from prediction to outcome, the 2006–2007 Rift Valley fever outbreak marked the first time that scientists were able to successfully predict an outbreak of the disease.[1. A. Anyamba et. al., “Prediction of a Rift Valley fever outbreak,” PNAS, doi: 10.1073_pnas.0806490106, 2009.]
Although this was a triumph 30 years in the making, rapidly advancing and ever-more-accessible remote-sensing technologies are making such disease-prediction models more commonplace. Similarly, specialists from a wide range of fields—from ecology and epidemiology to anthropology, marine microbiology, and animal behavior—are increasingly turning to satellite imagery to gain a more sophisticated, big-picture understanding of how organisms interact not only with their immediate environments, but also with the more expansive, global landscape. Here are some of the success stories.
Fighting Disease
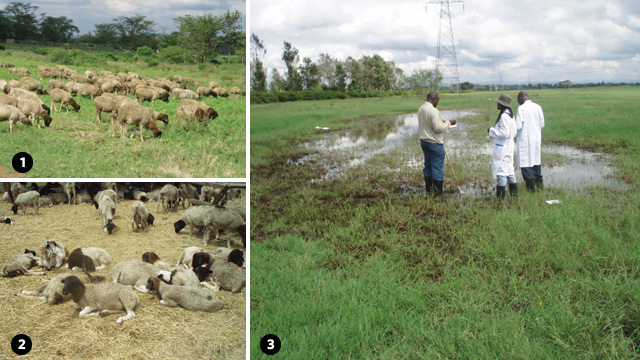
The Rift Valley fever outbreak of 1997 and 1998 was among the most widespread and devastating ever recorded—infecting approximately 90,000 people and killing several hundred. Although entomologist Kenneth Linthicum, now director of the Center for Medical, Agricultural & Veterinary Entomology at the US Department of Agriculture, had used satellite data in the 1980s to demonstrate a link between increased greening of vegetation (due to rainfall) and increased prevalence of disease (due to an upsurge in mosquito populations), the predictive power of his model was nowhere near good enough to forecast the 1997 Rift Valley fever outbreak.[2. K.J. Linthicum et al., “Detection of Rift Valley fever viral activity in Kenya by satellite remote sensing imagery,” Science, 235: 1656-59, 1987.]
It wasn’t until 1999 that Linthicum, together with remote-sensing specialist Assaf Anyamba at NASA’s Goddard Space Flight Center, made the key discovery that increased rainfall, vegetation greening, and disease transmission in northeastern Africa always followed an anomalous and prolonged rise in sea-surface temperatures in the West Indian and East Pacific Oceans, associated with the warm phase of the El Niño–Southern Oscillation (ENSO).
“When these conditions converge, then you are likely to have a big epidemic,” Anyamba explains.

Luckily, because the ocean surface warming occurs up to three months before the first heavy rainfalls in the Horn of Africa, Linthicum and his colleagues can now alert the countries at risk in time for authorities to potentially deal with the increased mosquito population in the flooded wetlands and the at-risk livestock that graze there before the disease affects humans.
“I believe that if people took the predictions seriously and implemented all kinds of control measures, including mosquito control, it’s possible that you could really diminish an outbreak or perhaps even prevent it,” Linthicum says.
One important factor that is currently missing from the model, however, is how changes in livestock immunity influence disease transmission. Because Rift Valley fever is primarily a zoonotic disease, drifting animal populations enable the disease to spread widely. “A lot of the areas that are impacted are those that are rangelands, where most of the people are dependent on livestock for their livelihood,” Anyamba says. People handling or feeding on infected livestock products like meat, raw milk, or blood are likely to become infected.
Tracking Biological Invasions
When British captains James Cook and George Vancouver sailed to the Hawaiian Islands in the late 1770s, they released herds of cattle, pigs, sheep, and goats into the wild. Having no native ground-dwelling mammals to compete with, the introduced animals flourished.
More than two centuries later, however, their arrival has proven catastrophic for the islands’ native fauna and flora. “They spread and consumed the native vegetation to the point that many species have gone extinct,” says Jim Kellner, an ecologist and plant biologist in the Department of Geographical Sciences at the University of Maryland, College Park.
Goats have been especially problematic in the dryland forests of Hawaii, where they kill and prevent the regeneration of endemic tree species, such as the mamane tree (Sophora chrysophylla), by stripping their bark and eating the seedlings. This is of extreme concern for Hawaiian ecologists and conservationists because the mamane tree is the main source of food and shelter for the critically endangered palila (Loxioides bailleui), a species of honeycreeper bird found only on the island of Hawaii.
To protect the mamane tree and the dwindling palila populations, researchers working for the US Army fenced off a lava-surrounded patch of forest, or kipuka, known as Alala in 2001 on the Big Island. The majority of the enclosed goats were herded out and the rest hunted until finally, in 2003, Kipuka Alala was declared ungulate-free.
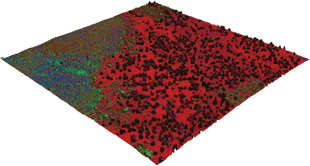
To test whether the removal of goats facilitated the regeneration of dryland forest trees, Kellner and a team of botanists and ecologists turned to NASA’s Moderate Resolution Imaging Spectroradiometer (MODIS)—an instrument aboard the Terra and Aqua satellites that has been measuring the visible and near-infrared light reflected from the Earth’s surface since the satellites were launched into space in 1999 and 2002. Using a data set encompassing nine years, the team was able to quantify how the vegetation cover had changed over time.
Not surprisingly, they observed an abrupt increase in vegetation cover in Kipuka Alala shortly after the goats had been removed, as compared to a similar forest with an unmanaged goat population.[3. J.R. Kellner, et. al., "Remote analysis of biological invasion and the impact of enemy release," Ecological Applications, 21:2094–104, 2011.] Unfortunately, on-the-ground sampling revealed that nearly all of the increase in vegetation seemed to be due to increases in exotic plant species and not native species. “Basically, the goats were removed and now the kipuka is overrun with weeds,” Kellner says.
One of the most problematic weeds they identified was Pennisetum setaceum, or fountain grass, a native grass of Africa and the Middle East that tends to burn frequently, thus preventing the regeneration of slower-growing trees. But even more troubling was the identification of Senecio madagascariensis—commonly known as fireweed or Madagascar ragwort—which accounted for the majority of the increase in vegetation cover observed at Kipuka Alala. Fireweed, while it doesn’t harm the palila, is toxic to livestock and spreads rapidly, and therefore is considered a major pest plant worldwide. In Australia, for example, fireweed infestation has cost millions in agricultural damage over the past three decades. Ironically, a cheap, particularly effective management strategy for keeping fireweed in check has been the use of goats, which are able to feed on the plant because they are less susceptible to poisoning.
“So it seems we’ve traded one problem for another,” Kellner says.
Although Kellner and his colleagues have amassed considerable observational evidence suggesting that the goats had been limiting the populations of exotic weeds, a more definitive understanding of the role that goats play in the kipuka ecosystem is needed before new management and conservation strategies can be implemented.
It may very well be that “we might have to choose the lesser evil,” says Kellner. “Which one is better, to have a kipuka overrun by goats, or a kipuka overrun by fireweed?”

Assessing Animal Behavior
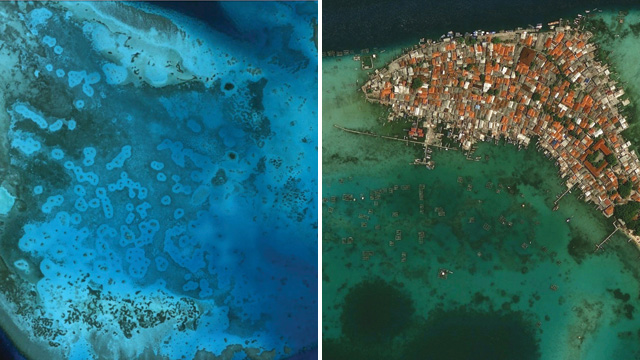
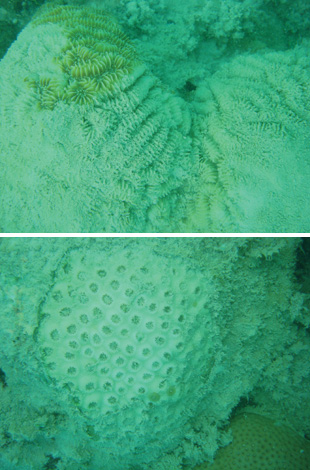
In the mid-1960s, a marine biologist working in the West Indies described for the first time conspicuous rings of bare sand surrounding coral reefs.[4. J.E. Randall, "Grazing effect on sea grasses by herbivorous reef fishes in the West-Indies," Ecology, 46:255–260, 1965.]
Known as grazing halos, these rings are formed by the collective behavior of tiny herbivores, such as damselfish, tangs, and sea urchins, that opt to graze close to the protection of the reef for fear of being eaten by predators out in the open water.
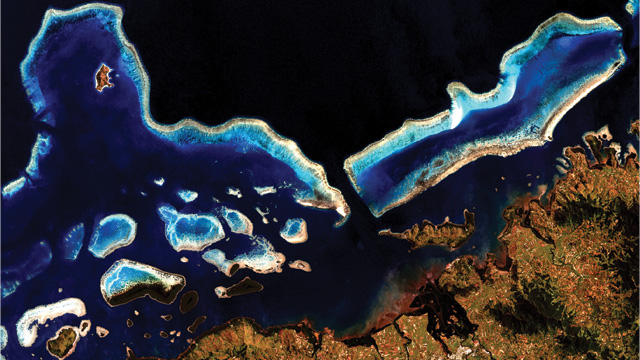
Elizabeth Madin, a marine biologist at the University of Technology in Sydney, wasn’t particularly interested in studying grazing halos, but when stormy weather left her and her husband grounded while on a research trip on Australia’s Heron Island, she decided to kill time by searching for them using publicly available Google Earth satellite images.
Madin was surprised at how clearly delineated the halos were when viewed from space.[5. E.M.P. Madin, et. al., “Landscape of fear visible from space,” Scientific Reports, doi:10.1038/srep00014, 2011.] The light-blue rims she saw surrounding the reefs on her computer screen were indeed bare stretches of ocean floor, devoid of seaweed, as she found out when she went looking for the halos on foot with the help of a GPS.
Currently, Madin is working on a World Wildlife Fund project to determine how such freely available satellite images of grazing halos can help marine biologists and conservationists monitor the health of coral reef ecosystems around the world. She believes, for example, that grazing halos, or the lack thereof, can be used as a proxy for overfishing along highly developed coastlines.
Mapping Coral Reefs
Although Landsat satellites have been photographing the Earth’s landmasses and surrounding coastal regions since the early 1970s, using high-resolution Landsat imagery for large-scale studies of coral reefs was still very impractical at the turn of the 21st century. “Even in the year 2000, we still didn’t know if the total area of coral reefs was 50,000 square kilometers or 500,000 square kilometers,” says Frank Muller-Karger, director of the Institute for Marine Remote Sensing at the University of South Florida, St. Petersburg.
The steep price (a Landsat photo covering an area of 170 by 183 kilometers could cost up to $5000 in the late 1990s) and the large amounts of computing power required to process the satellite data “really limited what you could do at the level of high-resolution coral studies,” he adds.
With funding from NASA, Muller-Karger and his colleagues purchased more than 1,400 Landsat 7 images acquired between 1999 and 2003 in order to outline and classify the world’s shallow-reef ecosystems. Completed in 2007, the Millennium Coral Reef Mapping Project produced the first uniform map of all the coral reefs around the world at a 30-meter-pixel resolution. The United Nations’ World Conservation Monitoring Centre is now refining the map in order to use it for global conservation efforts.
After the Environmental Protection Agency and Florida’s Fish and Wildlife Research Institute found that the live coral reef cover at a few sites in the Florida Keys had shrunk by 20 to 30 percent in the past three decades, Muller-Karger used a 25-year Landsat time series to confirm that the problem was widespread throughout the Florida Keys. By combining high-resolution satellite maps with water temperature and clarity data, Muller-Karger showed that areas with increasing or stable living coral cover tend to lie in regions with moderate variability in sea surface temperature and with relatively clear water (a proxy for water quality).
Interested in reading more?


