 MULTIFACETED MICROARRAYS: Researchers studying induced pluripotent stem cells are turning to microarrays to verify the genomic stability of their cells.© SAM OGDEN/SCIENCE SOURCEAs it becomes easier and easier for scientists to generate induced pluripotent stem cells (iPSCs) in the lab, validating and monitoring those cell lines will become a routine—but critical—business. The usefulness of iPSC lines for basic research and therapeutic applications lies in the stem cells’ ability to maintain an undifferentiated state; but a small fraction of iPSCs spontaneously differentiate as they’re passaged. Scientists using iPSC lines for regenerative medicine require that high genetic integrity be maintained uniformly through many cell passages. Thus, researchers have to validate and monitor any new cell line at its discovery and throughout its life in the lab—and microarrays are rising to the task.
“We’re trying to anticipate the needs of the stem cell and the iPSC community,” says Seth Taapken,...
Microarrays—generally, a chip or slide spotted with a collection of microscopic probes, usually nucleic acids or proteins that can bind fluorescently labeled samples—have long been useful for analyzing genotypes, transcriptomes, and proteomes. But as microarrays are rapidly becoming more affordable, together with streamlined software and data-analysis packages, researchers are beginning to look to this tool for their iPSC verification needs.
In the past few years, array-based techniques have cropped up to validate everything from the origin of iPSC lines to the long-term monitoring of differentiation status. Here, The Scientist profiles three types of microarrays that can help researchers track stem cell lines in their lab.
Birth Certificate
When researchers are preparing to reprogram an adult cell to pluripotency, or when they’ve just discovered a new iPSC, it is important to verify that the line has no genetic aberrations, such as a trisomy or a loss-of-function mutation, before and after reprogramming. Moreover, experts recommend checking for genetic abnormalities in stem cell lines every 15 to 20 passages, depending on the protocol used. “We estimated between 12 to 15 percent of cultures sent to our lab were exhibiting some type of change,” Taapken says of the stem cell lines sent to WiCell for verification.
Traditionally, researchers at WiCell and other stem-cell labs karyotype cells from each line to check for gross changes in the genome, which is cheap but not very detailed. Recently, some researchers have switched to comparative genome hybridization (CGH) microarrays, which are a bit more detailed, detecting abnormal gene copy numbers relative to a standard reference genome (usually provided by the array manufacturer). However, this analysis cannot detect changes such as loss of heterozygosity (LOH)—a mutation that leads to the loss of one allele for a gene that has already had the other allele de-activated —which is particularly prevalent in cancer stem cells.
To solve this shortcoming, some researchers are also using microarrays that detect single nucleotide polymorphisms (SNPs). These can spot slight variations—like LOH—between the genome in question and a reference genome. Moreover, custom-made SNP microarrays allow researchers to design DNA probes for a genome region of interest to their study. However valuable, this detailed view can’t provide the comprehensive probe of the entire genome that karyotyping or CGH arrays provide. To verify a cell line’s provenance, researchers also need to evaluate both chromosomal copy number changes and point mutations.
Solution: In October 2011, Agilent Technologies Inc. in Santa Clara, California, released the SurePrint G3 human CGH+SNP microarray line, which allows researchers to use a single array to survey newly identified stem cell lines for genetic copy-number changes as well as copy-neutral chromosome aberrations.
“What we really like about these arrays is that if you see a loss by the CGH probes on a chip, you can verify that the loss is real by the loss of heterozygosity in that region, as shown by the SNP probes on the same chip, instead of doing further testing,” Taapken says.
The arrays come in a variety of probe densities—ranging from 40,000 to 1 million probes—which gives researchers the freedom to choose how much genetic information they want about their iPSC lines, with an option to design custom SNP probes. But higher density isn’t always better, says Karen Dyer Montgomery, director of the cytogenetics laboratory at WiCell and a faculty member of the University of Wisconsin Stem Cell and Regenerative Medicine Center. “A lot of people don’t know what to do with an abnormal karyotype,” she points out—because mutations may not always have a clear impact on the line of research; thus the significance of abnormalities in a comprehensive array analysis may be hard to interpret. Moreover, as probe density increases, so does the price. But Montgomery and Taapken are confident that as more stem-cell genetic information is collected and array prices continue to fall, more researchers will be interested in the higher-density arrays.
Cost: Although pricing will vary between facilities and with the availability of scanning equipment, WiCell now offers CGH+SNP arrays at around $100 to more than $1,000 per array depending on density and sample number, with the lower price being similar to the cost of karyotyping.
Pros: Overall, the new Agilent CGH+SNP array platforms offer more information about a stem cell line than karyotyping, but at the same price.
Cons: If a stem cell line contains a small percentage of cells that have a genetic abnormality, microarrays aren’t as effective at determining that percentage as karyotyping—though microarrays are improving and karyotyping isn’t fool-proof.
Marks from a Past Life
 SPOTTING THE ANSWER: Once a microarray analysis is complete, researchers must put the data through rigorous statistical analyses.WIKIMEDIA COMMONSIn 2010, a group of researchers led by George Daley, director of the Stem Cell Transplantation Program at Children’s Hospital Boston, and Andrew Feinberg, director of the Center for Epigenetics at Johns Hopkins University School of Medicine, discovered that iPSCs generated using four reprogramming factors carried residual epigenetic marks from their previously differentiated states. In June 2012, the same team verified the existence of residual marks in human iPSCs. “Methylation patterns are not entirely erased” by factor-based reprogramming, Feinberg explains.
The result, Feinberg says, is an epigenetic memory that biases iPSCs to differentiate back into their original cell type. While the researchers suggest this may be useful for some research and therapeutic applications, the epigenetic status of iPSC lines should nevertheless be evaluated as researchers attempt to refine cell-reprogramming protocols.
Solution: Together with biostatistician Rafael Irizarry, also at Johns Hopkins, Feinberg’s group developed the comprehensive high-throughput array for relative methylation (CHARM). This specially designed DNA microarray allows for a comprehensive look at the methylome of a cell line fairly cheaply and with high precision.
Although a number of methods exist for isolating methylated sites from the genome, many are focused on surveying promoter regions and the CpG islands often associated with promoters. “We thought that researchers, including ourselves, were biasing their analysis by looking where everyone thinks you should look [for methylation],” says Feinberg. “I just wanted to look across the genome.” The group turned to an established enzymatic digest to pinpoint methylated regions, and designed an array using the NimbleGen HD2 customizable microarray platform that was relatively unbiased. They also developed statistical techniques that reduced the variability associated with high-throughput techniques. The analysis method that Feinberg and Irizarry applied, called smoothing, uses the regional methylation measures from the array and takes an average from a window, or group of points, to reduce the noise.
The group used the method to look at methylation patterns of iPSCs derived from four reprogramming factors, and compared them to those derived from somatic cell nuclear transfer. Both methods for creating iPSCs caused the methylation marks to reset, but they function by different mechanisms. Using CHARM, Feinberg’s group showed that the residual methylation in iPSCs derived by somatic cell nuclear transfer was more similar to embryonic stem (ES) cells. The iPSCs created by the reprogramming factors, on the other hand, had a greater epigenetic memory of their tissue of origin.
Cost: None available. NimbleGen, now owned by Roche, discontinued sale of the arrays used for CHARM, and is currently working on developing a replacement.
Pros: CHARM allowed for an in-depth survey of genome-wide methylation sites and was more precise and less biased than similar methods.
Cons: The decision to stop producing NimbleGen arrays has left many researchers, including Feinberg and his colleagues, in the lurch, he says. His lab is still using stockpiled NimbleGen arrays while they find a replacement array platform.
Regular Check-ups
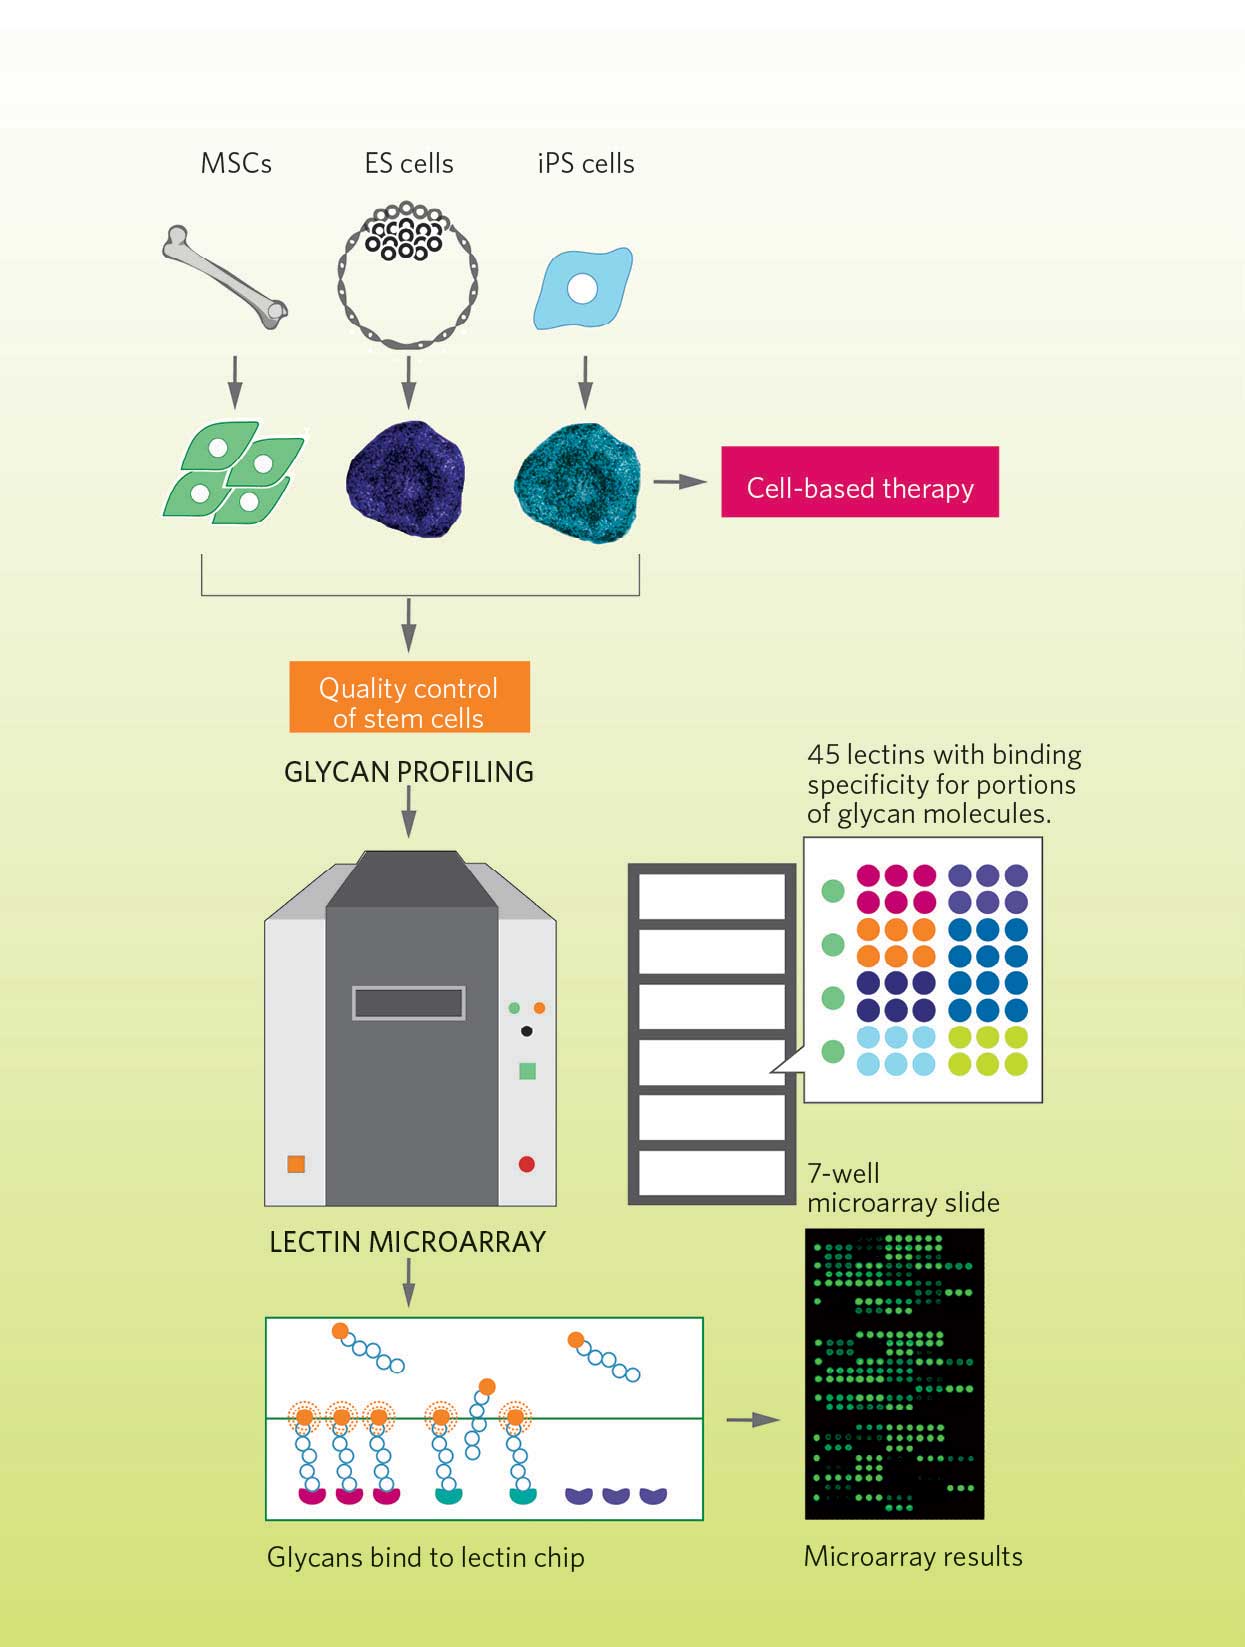
 GLYCAN PROFILING: Because iPSCs can revert to various differentiation states, they need to be periodically evaluated. Different iPSCs are covered in particular glycan patterns, depending on their differentiation. Therefore, Akihiro Umezawa and colleagues are using microarrays to scan for changes in these characteristic surface molecules.
View full sizeADAPTED BY ERIN LEMIEUX; COURTESY OF AKIHIRO UMEZAWAOnce an iPSC line has been established and validated, its differentiation potential might need to be monitored over the course of experimentation and passage. Stem cells have variable differentiation states, including pluripotency, multipotency, and unipotency. Since small fractions of iPSCs can spontaneously differentiate, it may be necessary to monitor the differentiation potential of an iPSC line as the cells are cultured and passaged.
Solution: A group of researchers in Japan, led by Akihiro Umezawa of the National Institute for Child Health and Development in Tokyo, has used lectin microarrays, produced by GP Biosciences of Sapporo, Japan, to monitor the differentiation status of iPSCs in the lab using patterns of glycans. Lectins are sugar-binding proteins from plants and animals, which can bind specifically to the glycans that cover a cell’s surface. Scientists have long used lectins to evaluate glycans, and Umezawa’s new method relies on 45 lectins that are spotted onto a glass slide to create a glycome-sensing microarray (LecChip by GP Biosciences).
Umezawa started by determining the glycome pattern on the surface of each iPSC differentiation type, in order to use these chips to quickly screen his cells. The protocol for the array analysis is easy, Umezawa says. Researchers extract the cell membrane proteins from as few as 100 cells using a commercially available kit (CelLytic MEM Protein Extraction kit from Sigma-Aldrich), label them with a fluorescent tag, hybridize the proteins to the array, and scan it using a GlycoStation Reader (GP Biosciences).
“We found discrete categories [of lectin array profiles] for each stem cell type using this technology, which was against my expectation,” Umezawa says.
Cost: Approximately $500 a chip.
Pros: The lectin microarray is fast and simple, requiring only a few hours to complete and a few days of training to master.
Cons: In order to compare and contrast profiles between cell lines and differentiated states in your lab, you need to first establish a database of glycan profiles for each cell line, which can be time-consuming and expensive.
Interested in reading more?


