Mass photometry and analytical ultracentrifugation help scientists characterize AAV, antibody, and protein-complex samples at every stage of biopharma development.
Every biopharmaceutical molecule tells a story in its heterogeneity. An adeno-associated virus (AAV) preparation is rarely a single, pure species: it is a mixture of empty capsids, fully loaded ones, and everything in between. An antibody sample may harbour monomers, fragments, and aggregates side by side. Getting that mixture wrong, or measuring it incorrectly, can determine whether a therapy reaches patients or stalls in development.
Gabriella Kiss, PhD Director of Market and Applications Development Refeyn Ltd.
In this Innovation Spotlight, Gabriella Kiss, director of market and applications development at Refeyn, explains what each technique actually measures, how sample requirements and throughput differ in practice, and what it takes for a new analytical method to earn a place in a regulatory standard.
What measurement problem do AAV, antibody, and protein-complex analysts all share?
They all need to identify and quantify heterogeneity. An AAV sample can contain empty, partially filled, full, and overfilled capsids; an antibody sample can contain monomer, fragments, and aggregates; and a protein complex can occupy several stoichiometries or assembly states.
Many established approaches, including size-exclusion chromatography with ultraviolet detection (SEC-UV) and size-exclusion chromatography with multi-angle light scattering (SEC-MALS), first separate these populations on a column. That works well for many samples, but some molecules interact with the column matrix, do not separate sufficiently, or change during analysis — so the result may not reflect the distribution originally present in solution.
Continue reading below...
Like this story? Sign up for FREENewsletter updates:
Latest science news storiesTopic-tailored resources and eventsCustomized newsletter content
A column-free method provides a useful alternative because it observes the populations without a separation matrix. The shared measurement problem is therefore straightforward: determine which species are present and their relative abundance while minimizing the chance that the analytical method itself alters or obscures the sample.
What do sedimentation-velocity AUC and mass photometry each actually measure?
Sedimentation-velocity AUC (SV-AUC) measures how a concentration boundary moves and spreads while molecules sediment in a centrifugal field. The primary result is a distribution of sedimentation coefficients. Sedimentation depends on buoyant mass, frictional resistance, and solvent density and viscosity, so AUC is a hydrodynamic measurement rather than a direct weighing method. With suitable models and supporting parameters, it provides information about size, shape, association, and heterogeneity across a very broad range. It is a bulk measurement: the optical system follows the collective behavior of molecular populations rather than measuring particles one at a time.
Mass photometry measures the interferometric scattering contrast of individual particles as they land on a glass coverslip. Within the specified mass range of approximately 30 kDa to 6 MDa, the calibrated contrast is highly linear with molecular mass—and that linearity enables accurate, reproducible mass measurement. Thousands of single-particle landing events are converted into a mass distribution: peak position reports mass, while event counts report the molar fraction of detected species.
The techniques therefore observe related questions from different perspectives—an ensemble sedimentation measurement versus a single-molecule mass measurement. Some numerical differences between them are expected, just as they are between other orthogonal methods. Interpretation requires understanding what each technique measures and how its signal is weighted.
Why does UV absorbance bias results toward larger species?
UV absorbance measures how much light a population absorbs, rather than counting how many particles are present. A larger assembly usually contains more light-absorbing material. For example, one dimer made from two identical monomers contributes roughly twice the UV signal of one monomer. If peak areas are used directly as percentages, a relatively small number of larger species can therefore appear more abundant than they are on a particle-number, or molar, basis.
This can be corrected when the molar extinction coefficient of each species is known. The challenge is that the necessary values are not always available, and different molecules within the same peak may not share the same coefficient. AAV adds another complication: empty, partially filled, and full capsids contain different proportions of protein and nucleic acid, so the measurement wavelength also matters. This is specifically a consideration for UV-based quantification, not every AUC optical system. Mass photometry counts individual detected landing events, so it directly reports the molar proportions of detected populations rather than weighing each event by its UV absorbance.
How much sample and how much time does each method need?
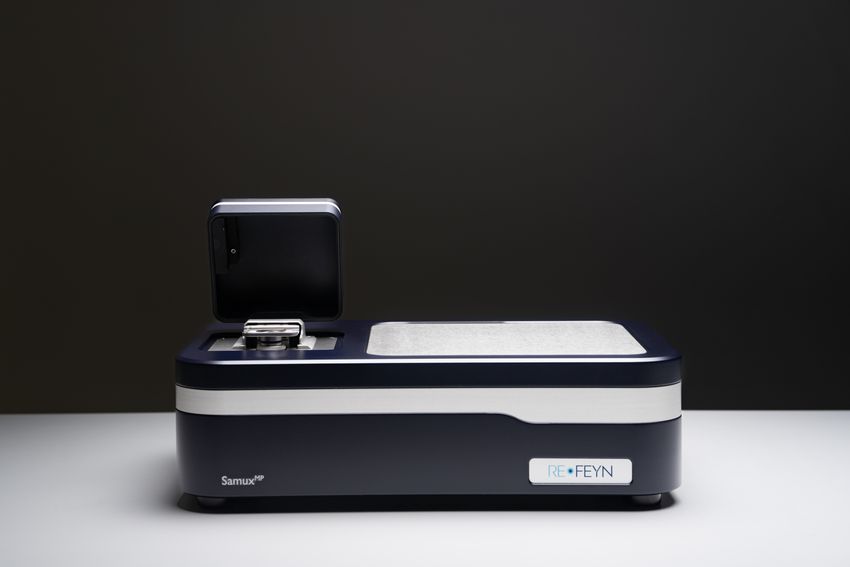
The SamuxMP mass photometry instrument measures individual biomolecule masses in solution, enabling rapid AAV characterization, viral vector quantification, and protein complex analysis from as little as 10 microliters of sample.
Refeyn Ltd.
For mass photometry, 10 to 20 microliters is placed in the well at low-nanomolar concentration, so only a small amount of analyte is consumed. Each measurement takes one minute, and the full measurement-and-analysis cycle typically takes about five minutes. That measurement time is fixed; unlike AUC, it does not depend on sample heterogeneity.
SV-AUC requires roughly 400 microliters at a much higher concentration. A well-designed sedimentation-velocity run takes six to eight hours and, in practice, often becomes an overnight workflow once cell preparation, equilibration, and analysis are included. Achieving AUC's best performance also requires expertise in cell and centerpiece assembly, balancing, and optimization of rotor speed, temperature, buffer, and optical settings. The choice is therefore a trade-off between the depth of separation required and the additional sample, time, and specialist effort needed to obtain it.
Where does AUC still outperform mass photometry?
When set up and analyzed correctly by an experienced specialist, AUC can provide better baseline resolution than mass photometry and covers a substantially wider mass range. AUC can examine very small species, including antibody fragments, as well as large aggregates and assemblies that fall outside mass photometry's specified range of approximately 30 kDa to 6 MDa.
One situation where AUC's resolution can be particularly valuable is a highly heterogeneous AAV sample containing several partially filled capsid populations. Optimized SV-AUC may separate those closely spaced populations with baseline resolution when mass photometry cannot. However, that additional separation capability may not always be required. If the objective is to quantify the principal empty, partial, and full populations for process development or routine monitoring, a five-minute mass photometry result may already provide sufficient information—with far less sample. The choice is therefore not resolution in isolation, but the resolution needed for a particular analytical decision.
What does it take for a new analytical method to be recognized in a regulatory or pharmacopeial standard?
It begins with a clearly defined industry need around a critical quality attribute or monitoring requirement. A new method must address a recognized gap—for example, poor reproducibility, excessive sample consumption, operational complexity, limited suitability for analytical laboratories, or the absence of a strong orthogonal method. Without a meaningful pain point, there is little reason to add another technology.
The evaluation is normally led by an established independent organization or a coordinated consortium, rather than arising from individual laboratories acting independently. Depending on the field, that could involve the National Institute of Standards and Technology (NIST), a pharmacopoeia, a standards organization, or an application-specific industry consortium. The lead group defines the analytical question, selects representative and well-characterized samples, establishes a common protocol, and recruits independent laboratories to participate.
Those laboratories analyze the same samples so the consortium can quantify variability, reproducibility, and robustness across instruments, sites, and operators. The candidate method is also benchmarked against established orthogonal technologies to understand agreement, differences, limitations, and the specific value it adds.
If the evidence is strong, technical committees can develop guidance or standard language through expert review, stakeholder consultation, and public comment. Inclusion recognizes that the method meets an industry need reproducibly; individual laboratories must still validate it for their product, sample type, and intended use.
How do orthogonal methods split a characterization package?
Analytical needs change throughout therapeutic development, so a characterization package should not use every method in the same way at every stage. In research and early process development, samples may be scarce and many formulations, purification conditions, or candidates must be screened quickly. A rapid, low-sample method can provide enough information to guide those decisions even if it does not deliver the maximum possible resolution.
Later-stage development and quality control may require greater precision, accuracy, and sensitivity to small changes in population distribution. More sample is usually available, samples are often purer, and buffer conditions are better controlled—making deeper or more demanding methods practical. A highly resolved AUC measurement may therefore answer a late-stage question that did not justify its time and sample requirements earlier.
The appropriate method depends on the development stage, sample type, critical quality attribute, and decision threshold. Maintaining multiple orthogonal methods for each important attribute allows teams to select the right balance of speed, sample consumption, resolution, and robustness rather than forcing one technology across the entire product lifecycle.
What do analysts most often misread in a mass photometry histogram?
People often misread what the percentage assigned to each peak represents—especially if they are familiar with SEC-UV or absorbance-detected AUC. Mass photometry measures the mass of each molecule, so the size of each peak depends on the number of particles counted with a given mass. The percentage of counts in a peak therefore represents molar, or particle-number, fractions. In mass photometry, a monomer and a dimer would each produce one landing event. In SEC-UV or absorbance-detected AUC, however, that dimer contributes roughly twice the signal of one monomer, so the uncorrected percentage is absorbance- or mass-weighted. To compare values across these techniques, one dataset must be converted to the same basis—using mass weighting or appropriate extinction-coefficient corrections.
Miles away from the closest ocean, marine microbes thrive in the red ice and mud around Blood Falls, offering clues to microbial adaptation and past climate events.
Explore how blood-based biomarkers perform across Alzheimer’s disease stages, including AIBL Study findings comparing p-Tau217 and other markers against amyloid-beta and tau PET reference standards.
Explore how super-resolution microscopy enables particle-level characterization of lipid nanoparticle composition, cargo loading, heterogeneity, and stability, providing complementary insights for formulation development and optimization.
The placements follow the commercial launch of Pyxa at the Advances in Genome Biology and Technology (AGBT) meeting in February 2026 and mark the company's transition from Early Access into global commercial availability.
The CellRaft AIR streamlines antibody discovery with imaging, functional screening, and gentle isolation of viable single B cells and hybridomas, helping verify monoclonality and identify high producing clones faster.
Load plasma directly into prefilled cartridges, no pretreatment, no ethanol. Under 30 minutes of instrument run time, up to 48 samples in parallel, with a high-throughput format also available.
Two Paige tools, powered by the Virchow pathology foundation model, are now available within a single image management workspace for oncology research.