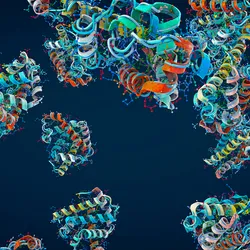
 PAINTING BY PEPTIDE: Multiplex mass-spectrometry image of a section through a rat kidney taken at 150 µm spatial resolution. Each color represents an individual peptide or protein of specific mass-to-charge (m/z) ratio. JUNHAI YANG AND RICHARD CAPRIOLI, MASS SPECTROMETRY RESEARCH CENTER, VANDERBILT UNIVERSITYLast year, when Albert Heck ran a commercially purchased sample of chicken ovalbumin through his mass spectrometer, he knew it would turn out to be more heterogeneous than researchers typically assumed. But his discovery that the commonly used molecular weight marker exists as at least 59 distinct proteoforms, each with a unique set of posttranslational modifications, was eye-opening. “We were expecting 10–15 proteoforms,” says Heck, the head of biomolecular mass spectrometry and proteomics at Utrecht University. “We were surprised.”
Heck’s finding underscores the growing need for and interest in top-down proteomics. Researchers have made huge strides cataloging the thousands of proteins that make cells tick, relying primarily on bottom-up approaches to build proteomics libraries. But because the bottom-up strategy consists of digesting the proteins, firing the fragments into a mass spectrometer, and then piecing the resulting data back together, the protein sketches it generates are out-of-focus composites, made up of averages glimpsed from among a fog of fragments. Top-down analyses, in which researchers feed intact proteins directly into mass spectrometers, capture the distinct characteristics of each one-of-a-kind proteoform.
“Molecular analysis should be done top-down,” says Neil Kelleher, professor of molecular biosciences and chemistry at Northwestern University, who has been pioneering top-down proteomics for more ...


