Infographic: Visualizing Gene Expression

STARmap reveals expression levels of multiple genes within thick tissue sections.

Written byRuth Williams
| 1 min read

Register for free to listen to this article
Listen with Speechify
0:00
1:00
Share

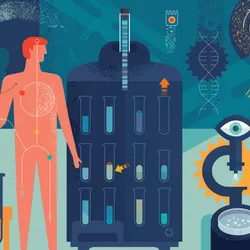
To visualize gene expression in a thick section of brain tissue with various cell types, RNA targets (top) are amplified to create multiple cDNA copies, each containing a barcode specific to the particular gene.

Acrylamide is then added to the tissue and cross-linked to the cDNA amplicons.

From the resulting hydrogel, fats and proteins are removed to leave a clear tissue within which the barcodes can be sequenced.

Read the full story.

Interested in reading more?

Become a Member of

The Scientist Logo
Receive full access to digital editions of The Scientist, as well as TS Digest, feature stories, more than 35 years of archives, and much more!
Already a member? Login Here

Related Topics

Meet the Author

  • ruth williams

    Ruth is a freelance journalist. Before freelancing, Ruth was a news editor for the Journal of Cell Biology in New York and an assistant editor for Nature Reviews Neuroscience in London. Prior to that, she was a bona fide pipette-wielding, test tube–shaking, lab coat–shirking research scientist. She has a PhD in genetics from King’s College London, and was a postdoc in stem cell biology at Imperial College London. Today she lives and writes in Connecticut.

    View Full Profile

Published In

October 2018

Bright Lights, Big Problems

Scientists are exploring the ecological damage caused by artificially lit night skies

Share
Image of small blue creatures called Nergals. Some have hearts above their heads, which signify friendship. There is one Nergal who is sneezing and losing health, which is denoted by minus one signs floating around it.
June 2025, Issue 1

Nergal Networks: Where Friendship Meets Infection

A citizen science game explores how social choices and networks can influence how an illness moves through a population.

View this Issue
Illustrated plasmids in bright fluorescent colors

Enhancing Elution of Plasmid DNA

cytiva logo
An illustration of green lentiviral particles.

Maximizing Lentivirus Recovery

cytiva logo
Explore new strategies for improving plasmid DNA manufacturing workflows.

Overcoming Obstacles in Plasmid DNA Manufacturing

cytiva logo
Unraveling Complex Biology with Advanced Multiomics Technology

Unraveling Complex Biology with Five-Dimensional Multiomics

Element Bioscience Logo

Products

The Scientist Placeholder Image

Waters Enhances Alliance iS HPLC System Software, Setting a New Standard for End-to-End Traceability and Data Integrity 

The Scientist Placeholder Image

Agilent Unveils the Next Generation in LC-Mass Detection: The InfinityLab Pro iQ Series

agilent-logo

Agilent Announces the Enhanced 8850 Gas Chromatograph

parse-biosciences-logo

Pioneering Cancer Plasticity Atlas will help Predict Response to Cancer Therapies