COURTESY OF WASHINGTON UNIVERSITY IN ST. LOUIS
September was a monumental month for genome aficionados. The National Human Genome Research Institute (NHGRI)–funded Encyclopedia of DNA Elements (ENCODE) Project released 30 papers in the pages of Nature, Genome Biology, Genome Research, plus another nine in Science, Cell, and the Journal of Biological Chemistry detailing functional features across the human genome. In all, ENCODE researchers performed nearly 1,650 experiments on 147 cell lines assessing transcription, transcription factor binding, chromatin topology, histone modifications, DNA methylation, and more.
The term that encompasses such myriad functional elements is epigenomics, and researchers are now well aware of the importance of such features in development and disease. So much so, in fact,...
There’s a lot researchers can do with these data sets. In an early demonstration, The University of Washington’s John Stamatoyannopoulos, a member of both the ENCODE and Roadmap consortia, and colleagues mined these data to address the puzzling fact that the vast majority of trait- and disease-associated sequence variants (SNPs) identified in genome-wide scans lie outside of any protein-coding sequence. By correlating those variant positions against accessible chromatin regions identified in the two epigenomics projects, Stamatoyannopoulos and his team found these variants often overlap with regulatory elements. They then identified the genes upon which those regulatory elements might act—some located hundreds of thousands of bases away (Science, 337:1190-95, 2012).
Both projects have made their data freely available to the research community, many of whom may want to see what these data sets have to say about their own particular gene, tissue, or pathway of interest. Yet for many researchers, handling, parsing, and visualizing so much information can be intimidating. The ENCODE data set alone weighs in at 15 terabytes.
The best advice, says John Satterlee, a Health Scientist Administrator at the National Institute on Drug Abuse and a co-coordinator of the NIH Roadmap Epigenomics Program, is just to jump in and see what’s there. “It’s not like you’re wasting reagents—this is just an in silico experiment,” he says.
We asked Satterlee and fellow experts to show us how to make use of these visualization tools. Here is what they said.
WHERE CAN I FIND THE DATA?
ENCODE project data are available at encodeproject.org, and may be visualized in the University of California, Santa Cruz (UCSC) genome browser (genome.ucsc.edu) by activating ENCODE data tracks in the track selection area (these are demarcated with an NHGRI “helix” icon).
You can view and/or download Roadmap Epigenome data sets from the National Center for Biotechnology Information (NCBI) Gene Expression Omnibus (www.ncbi.nlm.nih.gov/geo/roadmap/epigenomics), or view them as a remote “Track Hub” at the UCSC genome browser or one of several, generally faster, UCSC mirrors (e.g., www.epigenomebrowser.org). Other Roadmap visualization sites include the Human Epigenome Atlas (www.genboree.org/epigenomeatlas), hosted at the project’s data coordination site at Baylor College of Medicine; the Roadmap Epigenomics Data Browser (www.roadmapepigenomics.org/data); and the NCBI Epigenomics Browser (www.ncbi.nlm.nih.gov/epigenomics).
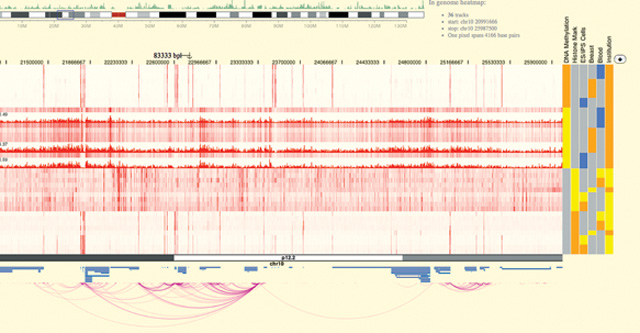
For something completely different, Washington University in St. Louis hosts a “next-gen” browser at epigenomegateway.wustl.edu (Nat Meth, 8:989-90, 2011). The WashU Epigenome Browser lets users diverge from the strict genome-centric view of the UCSC browser to, for instance, view all genes (or promoters, or 3’ UTRs) in a given pathway side by side. “You can do lots of Google Maps-style operations, and you can look at your data in the context of their metadata,” explains Ting Wang, a geneticist at Washington University School of Medicine. (See Epigenomics, 4:317-24, 2012 for a review of NIH Roadmap Epigenomics resources.)
HOW DO I SEARCH DATA SETS?
Both ENCODE and the NIH Roadmap Epigenomics Project provide data matrices so users can browse data sets by cell or tissue type, or by epigenetic mark. “You can select along at least three dimensions,” explains Aleksandar Milosavljevic, a geneticist at Baylor College of Medicine. “One can select sample types, assays, and genomic coordinates.”
Suppose, for instance, that you are interested in H1 human embryonic stem cells. From the ENCODE project home page, select “Experiment Matrix” in the navigation bar on the left side of the page; the resulting clickable table shows you that the project has produced 124 data sets, including 10 RNA-seq and 91 ChIP-seq analyses, for H1-hESC cells. Clicking any box in the matrix allows you to view those particular data in the UCSC genome browser.
Roadmap Epigenomics data matrices are available on the Human Epigenome Atlas and Roadmap Epigenomics Data Browser. Use the search windows on both sites to filter by tissue type as needed. Alternatively, users can scan tissue types visually by selecting one of three options (Embryonic Stem Cells, Fetal Tissues, or Adult Cells & Tissues) under the Visual Data Browser heading at the top of the Roadmap Epigenomics Data Browser. This project collected 106 H1 embryonic stem cell data sets, according to the Atlas, and you can scan them all for your gene or genes of interest, if you wish.
HOW DO I FIND THE EPIGENETIC STATE OF MY GENE?
All genomic and epigenomic browsers allow users to view specific genomic locations. UCSC browser users can specify a given gene (say BRCA1) or genomic locus in the search window at the top of the browser page. The data are presented as graphs of signal intensity vs. genomic position, and like all UCSC browser tracks, may be turned on or off and moved up or down to simplify visualization.
In the WashU Epigenome Browser, after selecting your genome of interest (human, mouse, Drosophila, and more), you can view specific genomic locations by clicking Apps > Relocation in the browser’s floating window. To view all genes in a given pathway at once, scroll to the vertical menu at the bottom of the browser window and select Genomic View > Gene Set View > KEGG Pathways (or, for unrelated genes, Custom Gene Set). For instance, try “path:hsa03420,” the nucleotide excision repair pathway. The resulting view shows you 68 genes from that pathway side by side, even though they are located on different chromosomes.
This particular browser’s view is highly configurable; try right-clicking on individual data tracks in the genome heatmap to change each row’s appearance. Or, sort by metadata, such as epigenetic mark or cell type, by clicking the metadata heatmap at the right of the browser. The browser also recently added a nifty “long-range interaction tracks” feature, which allows users to view ENCODE project chromatin-interaction data produced by such techniques as 5C, HiC, and ChIAPET. These appear as “arcs” beneath the genome tracks, linking distal, but physically connected, chromosomal regions.
“There has been quite a bit of technology development in assays to profile chromatin interaction . . . but no good ways to visualize [those interactions] on a linear genome browser,” Wang explains.
If you’re interested only in the epigenetic state of specific genes in isolation, you can also view them outside of a genome browser. From the Human Epigenome Atlas home page, link to the current release to access the data matrix page, then select the boxes corresponding to the data sets of interest. Select the six MeDIP-Seq and MRE-Seq data sets (methylation and lack of methylation, respectively) for Breast Luminal Epithelial Cells, Breast Myoepithelial Cells, and Breast Stem Cells. At the top of the window, click Selections > View In > Atlas Gene Browser.
In the page that comes up, type BRCA1 in the Gene search box. The page will display bar graphs of average methylation intensity across each of the gene’s 23 exons, introns, and its promoter. You can select additional genes by clicking Add Gene (e.g., BRCA2), or add genes from the same pathway by clicking the Pathway Browser button (three red circles arranged in a triangle).
HOW CAN I GET A BIRD’S-EYE VIEW OF THE EPIGENOME?
In the WashU browser, right-click on any data track in the genome heatmap and select Genome Snapshot; the resulting pop-up maps that particular data set across all 23 human chromosomes, allowing you to zoom in on points of interest. From this view you can see that trimethylation of lysine-9 on histone H3 (H3K9me3) is highly enriched (i.e., there are sharp signal peaks) around each centromere in the HUES6 human embryonic stem cell line.
If you’re looking for genes that differ, epigenetically speaking, between two cell types or conditions, try the NCBI Epigenomics Browser’s “Compare Samples” tool. It highlights the most epigenetically different genes in any two data sets—a good way to identify genes that might be differentially regulated. Comparing lysine-27 trimethylation on histone H3 (H3K27me3) in human fibroblasts and human embryonic stem cells, for instance, flags 20 genes with variable levels of distinctiveness.
HOW DO I COMPARE MY OWN DATA TO THE PUBLIC DATA SETS?
Say you’ve already mapped H3K27me3 across your gene of interest. You can overlay those data on the ENCODE or Roadmap data sets. The easiest option, says Lisa Chadwick of the National Institute of Environmental Health Sciences (NIEHS), one of the Epigenomics Roadmap’s program directors, is uploading a custom data track of those data to the UCSC genome browser. From the browser home page, select Genome Browser at the top of the left navigation bar, then in the search box select Add Custom Tracks. Your data must be properly formatted for display, for instance, as bigBed or bigWig files. (See the UCSC genome browser User Guide for more information.)
COURTESY OF ROADMAP EPIGENOMICS PROJECTThe WashU Epigenome Browser also supports custom tracks. Scroll to the bottom of the window, and select Tracks > Custom Track. Users can also batch upload multiple tracks, creating what’s called a “data hub,” says Wang.
WHERE CAN I GO FOR MORE INFORMATION?
The epigenome projects presented massive data visualization problems, Chadwick says, simply by virtue of the size of the data sets—not to mention the fundamental complexity of the data themselves. “That’s why we ended up with all these different sites and all these different ways to look at [the data],” she says, “because there’s no one way to do it.”
Because each site is a bit different, the only way to see what they can do is to try them out. Help is available, however. There is a video tutorial on working with ENCODE data in the UCSC browser, at www.openhelix.com/ENCODE/. WashU has produced several video tutorials on its next-gen browser, too, available at epigenomegateway.wustl.edu.
For more hands-on help, Baylor College of Medicine organizes workshops, each with up to 40 participants, which focus on its epigenomics tools and provide FAQs and Use Cases to walk researchers through some common data-analysis problems. According to Milosavljevic, these workshops center around Genboree Workbench (Genboree.org), a Baylor-built framework that integrates epigenomics and genomics software tools with epigenomic and omics data sets, such as transcriptome and genome data. “Our goal as a data coordination center is not only to deliver these reference data sets but also to enable disease projects and basic science projects to probe these data sets using an integrated suite of tools and perform analyses that combine their own private data with public reference data sets,” Milosavljevic says.
The last of three 2012 Epigenome Informatics workshops was held in early October, with more scheduled for 2013, says Milosavljevic. For those who cannot wait that long, Chadwick, a program administrator in NIEHS’s Division of Extramural Research & Training, along with NHGRI staff representing the ENCODE consortium, will be holding a satellite workshop on November 8 at this year’s American Society of Human Genetics annual meeting in San Francisco.
“It’s just going to be a couple of hours where we’re going to be talking about, from a human genetics perspective, how this kind of data could be useful to you, and where you can find the data,” Chadwick says.
Given the complexity of the epigenome data sets, and their potential value, that sounds like time well spent.