© TETIANA YURCHENKO/SHUTTERSTOCKIn the last decade, a growing number of drug discovery researchers have replaced robots and reagents in their high-throughput screens with computer modeling, relying on software to identify compounds that will bind to a protein target of interest.

Researchers often combine virtual screening with other computational tools that make predictions about the activity of individual compounds, such as how they will interact with proteins. Together, these tools help narrow down large libraries of compounds into a subset to test experimentally. The biggest compound libraries boast several million molecules, an unrealistic load for the best-equipped lab to screen the old-fashioned way. Experimentally testing more modest libraries of thousands of molecules would still strain the resources of academic researchers, who are increasingly tackling drug discovery. “As an academic lab, I can’t afford to buy thousands of compounds to do a high-throughput screen, but I could afford to buy...

Computational tools have their own challenges, however. Depending on the type of predictions the program makes and the size of your library, these screens could take hours to days to run. Some programs require users to perform basic coding. And of course, virtual hits have to be validated in the lab for their ability to actually bind to the target and modulate its activity.

The Scientist surveyed some of the most widely used, freely available computational tools to help you take your drug discovery online.

SHRINKING THE COMPOUND LIBRARY
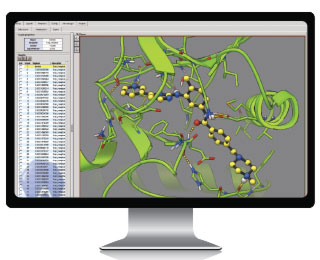
ATTEMPTING TO DOCK: AutoDock programs test and analyze interactions between small drug-like molecules and biological targets. In the AutoDock Raccoon graphical interface shown here, researchers view the 3-D structure of these complexes, such as between the kinase protein (green ribbons) involved in chronic myelogenous leukemia and the anti-cancer drug imatinib (Gleevec). The graphical interface displays the hydrogen-bond network (dotted lines) responsible for the activity of this drug. IMAGE BY DR. STEFANO FORLI, THE SCRIPPS RESEARCH INSTITUTE. vROCSIn traditional high-throughput screening, researchers look through a haystack of compounds to identify a few that bind to a protein target of interest. Screening 20,000 molecules might yield 5 hits.

Virtual screening tools that make predictions from the target’s properties may enrich the true binders in the population by 100- to 1,000-fold or more, says Spencer Ericksen, an assistant scientist at the Small Molecule Screening and Synthesis Facility at the University of Wisconsin–Madison. From a list of virtual hits, you could test only 200 or so compounds in a binding assay in the lab to get 5 hits.

The catch, however, is that to use these tools you’ll need a crystal structure of your target. The Protein Data Bank (www.rcsb.org/pdb/home/home.do) is a good place to look for available structural information. If your target’s structure is unknown, you can use MODBASE (modbase.compbio.ucsf.edu/modbase-cgi/index.cgi), which looks for homologous proteins, to predict it. However, using a predicted structure makes the screening results—particularly the predicted binding strengths between target and ligands—less reliable.

Crystal structures often include not just a protein but a compound to which it is bound, thus revealing a binding site. You can tell your screening program to focus on that site. If you don’t have any information about binding sites, FTMap (ftmap.bu.edu/home.php) suggests possible sites by looking for pockets on the surface of the protein.

You will also have to choose a compound library for virtual screening. One widely-used database for these libraries is ZINC (zinc.docking.org/browse/subsets/) (J Chem Inf Model, 52:1757-68, 2012). Make sure you select one of the “In Stock” libraries, as some researchers have had problems with the physical versions of virtual hits not being available. Ericksen uses a type of “In Stock” library called “Drugs Now.” It contains only compounds with drug-like properties, such as a molecular weight below 500 daltons (Drug Discov Today Technol, 1:337-41, 2004), and removes the so-called PAINS molecules, which contain molecular structures with nonspecific activity (Nature, 513:481-83, 2014).

Once you are ready to do your target-based virtual screening, one of the most popular tools is a free program called AutoDock Vina (vina.scripps.edu/download.html). A tutorial on the Vina site describes the steps for testing a single interaction between a target and compound. Because the program runs just one such test at a time, you’ll need to write a basic script to repeat the test on all of your chosen compounds, Ericksen says. A single test involves uploading the protein and ligand files and converting them to the program’s file format. In addition to selecting a binding site for the protein, you can designate several bonds in the binding site to be flexible, increasing the chance of finding interactions. Running the binding simulation takes about one minute and gives you a predicted binding affinity, which is calculated based on the frequency with which similar interactions are reported in the Protein Data Bank.

AutoDock Vina and its predecessor, AutoDock, were developed by Arthur Olson, a professor of integrative structural and computational biology at the Scripps Research Institute in La Jolla, California. In general, AutoDock Vina outperforms AutoDock in accuracy and speed, Olson says. But AutoDock does a better job modeling water molecules or metal groups, so if you suspect your target-ligand interaction could involve these types of complexes, give the older program a try, he adds.
At the end of the screening you will have a predicted binding affinity for each compound. Ericksen does quality control on the best binders: he checks the top 0.1 to 1.0 percent in ChemMine Web Tools (chemmine.ucr.edu), which groups compounds with similar chemical structures into clusters. He reasons that virtual hits are more likely to be real if their chemical structures come up many times in the screen (compared with their abundance in the entire library), so he selects compounds in the biggest clusters to pursue with more virtual and experimental testing.

FINDING SIMILAR COMPOUNDS
LOOKING FOR LIKENESS: ROCS software searches compound libraries for molecules that are similar in shape and chemistry to a compound of interest. This image shows vROCS, the software’s graphical interface, overlaying a query molecule, a known cyclin-dependent kinase 2 ligand, and a hit molecule (gray) that has similar features, and is, thus, predicted to have similar activities.COURTESY OF OPENEYE SCIENTIFIC SOFTWARE INC.Often, researchers already have a compound in mind when they start down the drug-discovery pipeline—a ligand that they found to have desirable activity in a functional screen, for example, or one that has been associated with a disease in the literature. Before conducting assays in the lab to learn more, it can be a good idea to look for similar compounds that might be more potent or have other advantageous properties.

Traditionally, this was a task for medicinal chemists, but ligand-based virtual screening tools are now doing these searches in silico. The ROCS application by OpenEye Scientific Software looks through a database of compounds for ones whose shape and chemical features, such as hydrogen-bond acceptors/donors and cations/anions, are most similar to those of your compound of interest. In some cases, ROCS seems to more accurately predict 3-D molecular similarity than other tools that only look at active chemical groups, or pharmacophores.

Academic researchers whose aims are strictly or primarily noncommercial can apply for a free or low-cost license from OpenEye (www.eyesopen.com/academic) which allows them to download ROCS and vROCS, the program’s graphical interface that is more accessible to new users. Information about how to use these tools is available online (docs.eyesopen.com/rocs/). The first step is converting your query molecule into a predicted 3-D shape. To do this, enter either the 2-D image or the linear notation (called SMILES, which stands for simplified molecular-input line-entry specification), into vROCS’s “Create a query with a wizard” task on the home screen. Check the conformers of the shape you want to query, and click “Finish.” Go to the “Perform a simple ROCS run” task, where you will see those query shapes listed. Then, upload the data set of compounds to search.

If you use ZINC for your data set, make sure to download your ZINC library as a Flexibase file that contains predicted conformations of each compound. After you click “Run” in vROCS, the compounds appear at the bottom of the window ranked in order of similarity to your query. They are identifiable based on the 6-digit number at the beginning of each name. (For ZINC libraries, that number can be searched on the ZINC site.) Many researchers choose to pursue the top 25 to 50 hits from ROCS, depending on the capacity of their screening setup, says Paul Hawkins, an applications scientist at OpenEye.

UNDERSTANDING THE ACTIVITY OF COMPOUNDS
PREDICTING BINDING PARTNERS: ChemProt-2.0 predicts the biological targets that a small molecule can interact with by scouring databases of reported interactions between that molecule, as well as similar molecules, and proteins. The results of a search, pictured here, list predicted binding partners and diseases in which they have been implicated.WWW.CBS.DTU.DK/SERVICES/CHEMPROT-2.0/Computational tools don’t just help you identify target compounds; they can quickly tell you more about them. After amassing a collection of compound hits, Edgar Jacoby and his drug-discovery team at Johnson & Johnson in Beerse, Belgium, head straight to search engines such as ChEMBL (www.ebi.ac.uk/chembl/).

ChEMBL, an open-access database operated by the European Molecular Biology Laboratory, contains more than 5 million interactions between proteins and ligands that have been published in peer-reviewed journals or reported by laboratories and screening centers (Nucleic Acids Res, 40:D1100-07, 2012). Under ChEMBL’s “Ligand Search” tab, you can enter a compound’s SMILES notation in the “List Search” box and click “Fetch Compounds.” On the next page, clicking on the ChEMBL compound identifier under the 2-D drawing takes you to the Compound Report Card page, which includes the “Protein Target Classes” and tables containing the proteins that are predicted to bind with the highest affinity.

The list of reported interactions in ChEMBL can help you decide how to prioritize the compounds or even eliminate them from your drug-discovery pipeline. Compounds that bind to many unrelated proteins or that take part in interactions that seem likely to lead to adverse drug reactions should sound the alarm. Jacoby cautions, however, that a compound may look good in ChEMBL just because it has not been studied enough for undesirable interactions to be uncovered. To suss these out, he recommends tools that make predictions about interactions.

One of these is SEA (sea.bkslab.org/search/), which makes its predictions based on interactions that have been reported for compounds with a similar collection of chemical groups. (Such characteristic chemical groups are termed the “molecular descriptors” on the SEA search page). Enter your compound’s SMILES notation in SEA’s “Query Compound” box along with an arbitrary one-word identifier to help you keep track of multiple searches. For the “Database to search against,” select the most up-to-date version of the ChEMBL database (currently, version 16). (The site also lets you search other databases, such as MDDR and WOMBAT, but John Irwin, an adjunct associate professor at the University of California, San Francisco, and cocreator of SEA, points out that they are not public and, thus, don’t tell you the identity of the similar compounds involved in each interaction.) On the results page, the proteins listed at the top in the light blue box are ones that have been reported to bind your compound. The rest are ranked in order of E-values. Irwin says that each E-value should be considered relative to the others in the list (lower values mean greater binding likelihood); it is not possible to correlate E-values with actual binding likelihood, however. Clicking “View” shows the list of related compounds that have been shown to bind that protein. A commercial version of SEA is also available for users who want to screen thousands of molecules at once.

A similar tool called ChemProt (www.cbs.dtu.dk/services/ChemProt-2.0/) allows you to search several databases at once, including CTD (ctdbase.org), which gives information about environmental pollutants. Submitting a compound’s SMILES notation yields a results page that lists the predicted proteins as well as their association with diseases in the “Disease Categories” table. Jacoby says ChemProt and related sites, such as Open PHACTS (www.openphacts.org), that also provide disease data can help researchers zero in on clinically important protein interactions and are “the next generation” of this class of tools.

Interested in reading more?

Magaizne Cover

Become a Member of

Receive full access to digital editions of The Scientist, as well as TS Digest, feature stories, more than 35 years of archives, and much more!